Polynomial Regression
Sample Results as an Excel Table:
| Polynomial Regression | |||||
| X-Variable: | Horsepower | ||||
| Y-Variable: | Mileage | ||||
| N | R | R-Square | Std.Error | ||
| normal | 72 | 0.716106522 | 0.512808551 | 3.201193259 | |
| corrected | 0.700938521 | 0.49131481 | |||
| 95% | |||||
| Coefficient | Conf. (±) | Std.Error | T | P | |
| Constant | 31.39761035 | 4.885395771 | 2.448244342 | 12.82454117 | 8.04638E-20 |
| X | -0.34087278 | 0.135338066 | 0.067822684 | -5.025940583 | 3.87252E-06 |
| X ^ 2 | 0.002003233 | 0.00109185 | 0.000547165 | 3.661114558 | 0.00049197 |
| X ^ 3 | -3.79134E-06 | 2.51257E-06 | 1.25914E-06 | -3.011062054 | 0.003651949 |
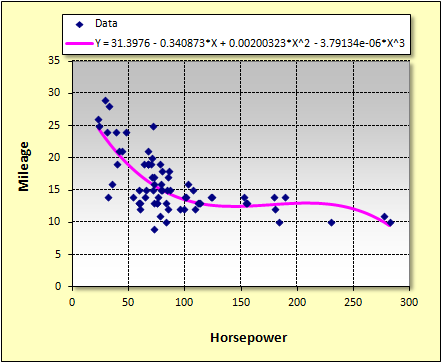
Sample Results as an Excel Chart: